This week, my students choose their topics for their research papers. Since I’m teaching a general education writing class which is required of all freshmen, the topic can be literally anything. I have to approve it, but I’ve been pretty flexible. After all, I might learn something interesting! Not to mention reading 25 papers on the same thing is eye-numbingly boring.
Their topics are pretty cool. One’s looking at violence in video games, one’s looking at the ethics of stem cell treatments, one’s looking at rap and hip hop culture, one’s looking at whether college is economically worth it. You can really see their interests and the stuff they’re thinking about with this.
Three of them are doing papers on drugs. One on alcohol, one on ecstasy, and one on marijuana. This is understandable. They go to a school that consistently makes top-10 lists for “best party school.” But it really got me thinking: statistically, how much are they really partying? I basically assume most have tried alcohol, more than half are drinking and having sex on the weekends and have tried marijuana, and a couple probably use harder drugs occasionally or use alcohol daily.
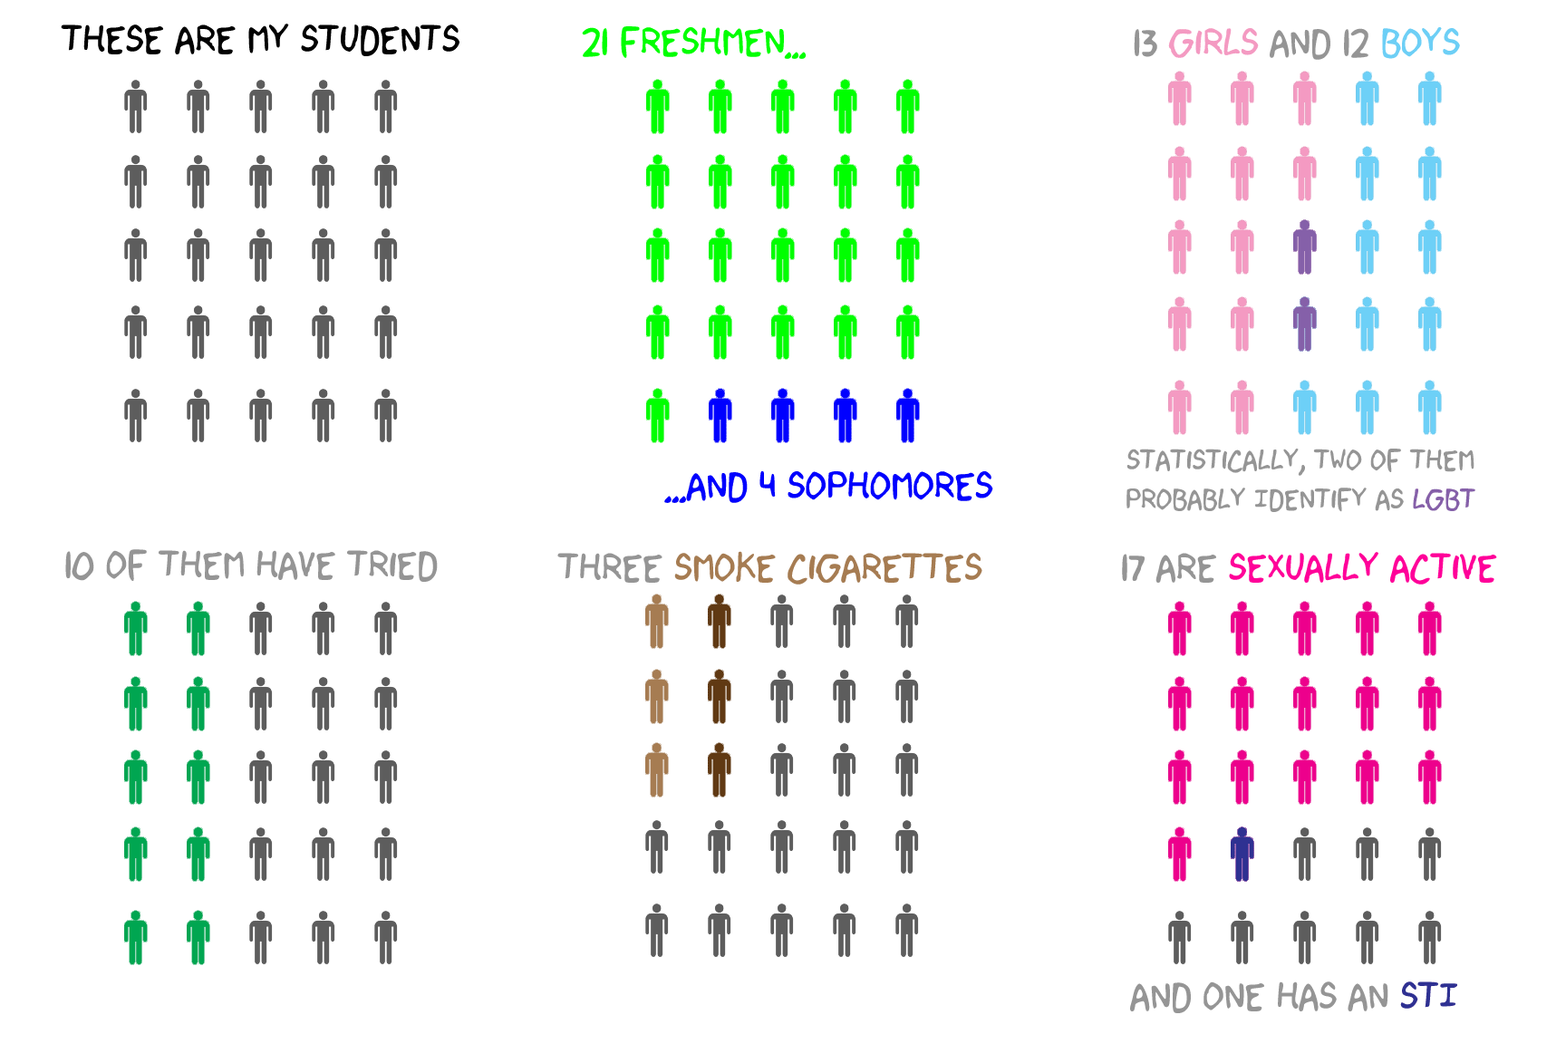
I tried to research to see if my assumptions were correct. This is what I came up with, in infographic .gif form, complete with xkcd style font:
I should note some disclaimers about the data used. The data for number of students, number of freshmen, and number of sophomores are absolutely correct. The data for their genders are based on my assumptions from their outward appearance and their names. I don’t know if they identify as something else, but this is how they present themselves. Everything else is based on statistics from other surveys, not of UCSB freshmen but of college students in general across the nation. For all I know, 5 of them could identify as LGBT and only 1 smokes cigarettes. That’s the nature of statistics. It’s just an average. Take it with a grain of salt.
I found a couple of UCSB-specific sources citing a study taken by UCSB students, but I couldn’t find the original study broken down by college. Instead, I just have the national averages for drug, alcohol, and sexual activity among college students. I also have the data for UCSB students’ use of Adderall. Being a liberal state whose biggest cash crop is pot, I suspect their cannabis use is quite a bit higher than the national average (at least for those who have ever “tried” it, even once). Being a “party school,” their sex, STI, and alcohol rates may be higher too, although I feel these statistics may be about right. I honestly feel the national averages for cigarettes are above those of my students, as they’re generally health-conscious and we’re a tobacco-free campus. But that’s just my intuition. Who knows?
I find I enjoy making infographics. Visualizing data is so fun! :)


